
Somewhere near the end of a board meeting, a member who has been quiet all evening asks the question: so — are we financially healthy?
You have the statements in front of you. You know what is in the bank. And still the honest answer that forms in your head is something like “I think so,” which is not an answer anyone can act on, including you.
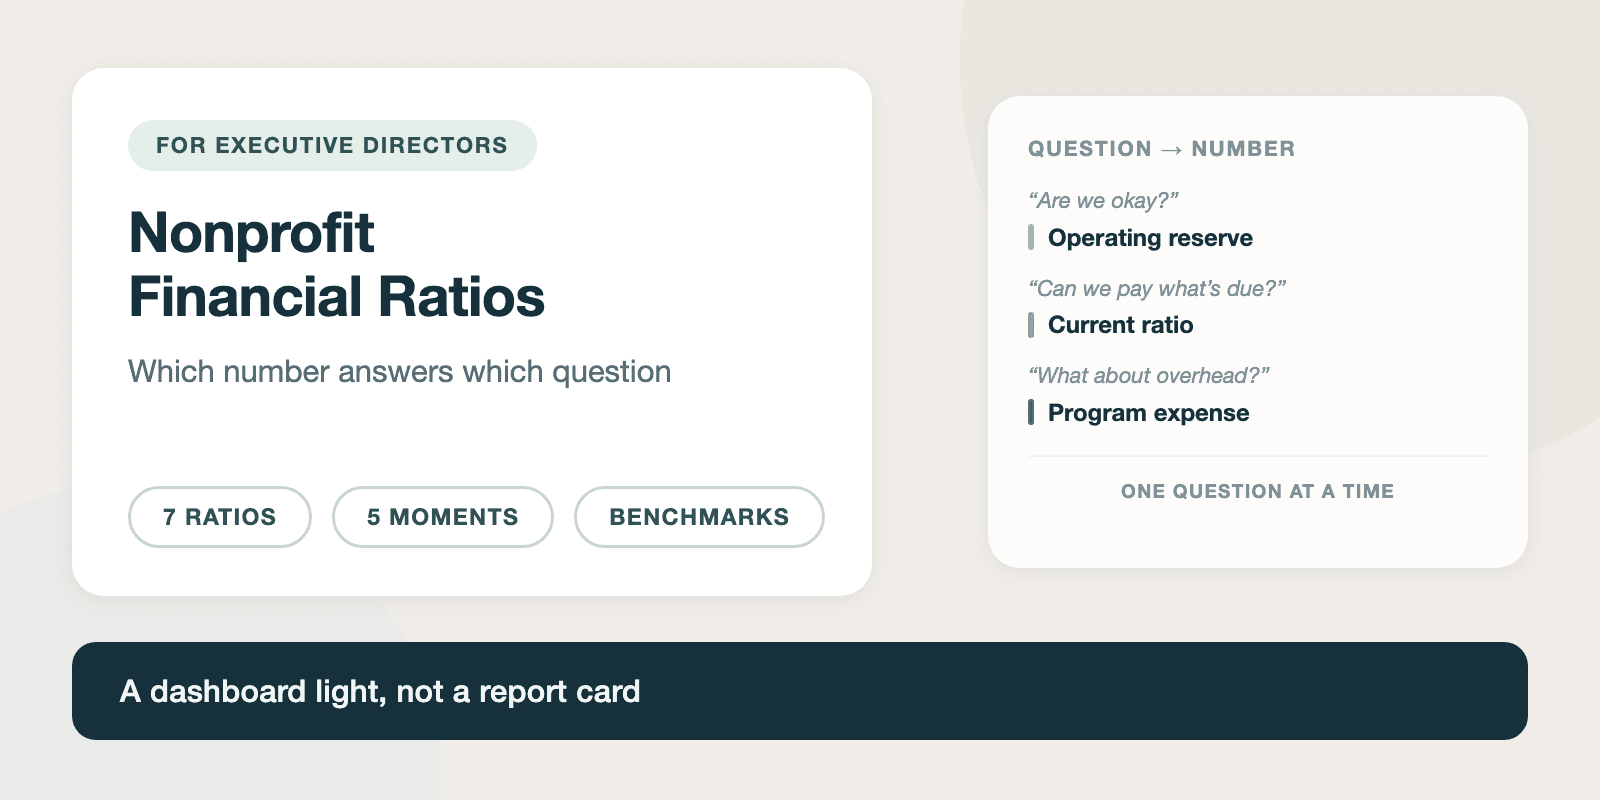
That gap is what nonprofit financial ratios are for. Not to grade you. A ratio is closer to a dashboard light than a report card — it does not tell you how good a driver you are, it tells you which part of the engine to look at, and only when something is worth looking at. The organizations that get value out of these numbers are not the ones tracking the most of them. They are the ones who know which number answers which question, and which moment each question actually belongs to.
Key Takeaways
A financial statement tells you what happened. A ratio tells you whether what happened is a problem. That is the entire difference, and it is why a ratio can be useful to someone who does not enjoy reading financial statements.
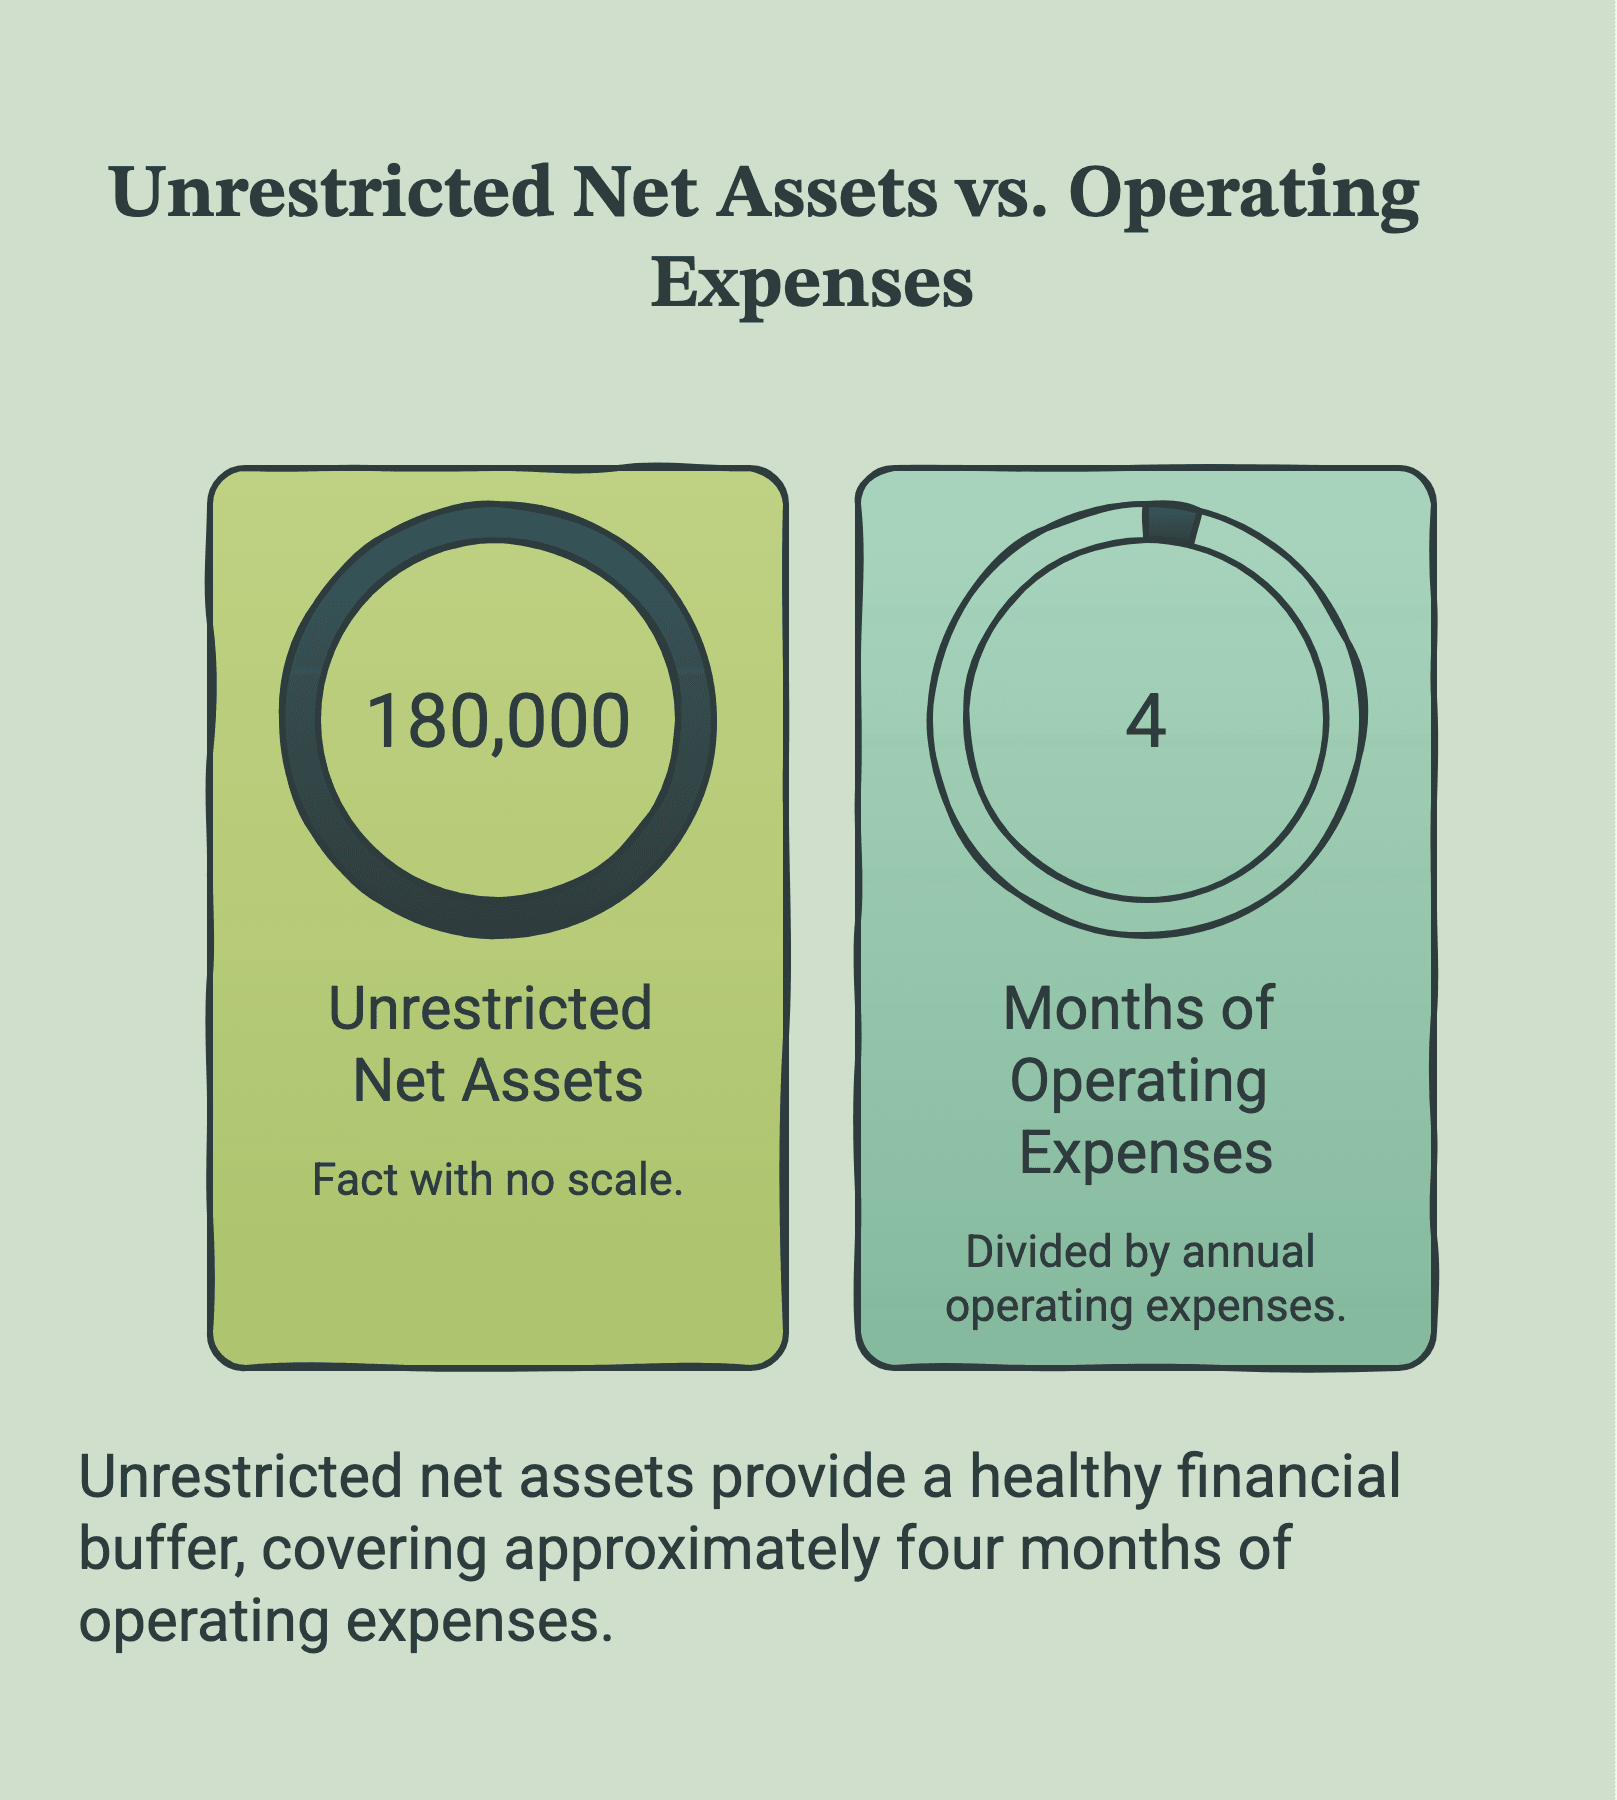
Take a number on its own: $180,000 in net assets without donor restrictions. Is that good? There is no answer to that question. It is a fact without a scale. Divide it by what the organization spends in a year — say $540,000 — and it becomes something an ED can use: about four months of operating expenses, comfortably past the three-month minimum discussed below, and enough to survive a delayed grant payment.
The second thing a ratio does is make organizations comparable to themselves over time. Your budget grew 30% this year, so of course fundraising costs went up in absolute dollars. Whether they went up faster than what they brought in is a different question, and only a ratio can answer it.
What a ratio is not: a measure of whether your work matters. Program expense ratio does not know whether your program works. It knows how your accountant coded your expenses. That distinction gets lost constantly, including by people who should know better, and it is worth holding onto before we go any further.
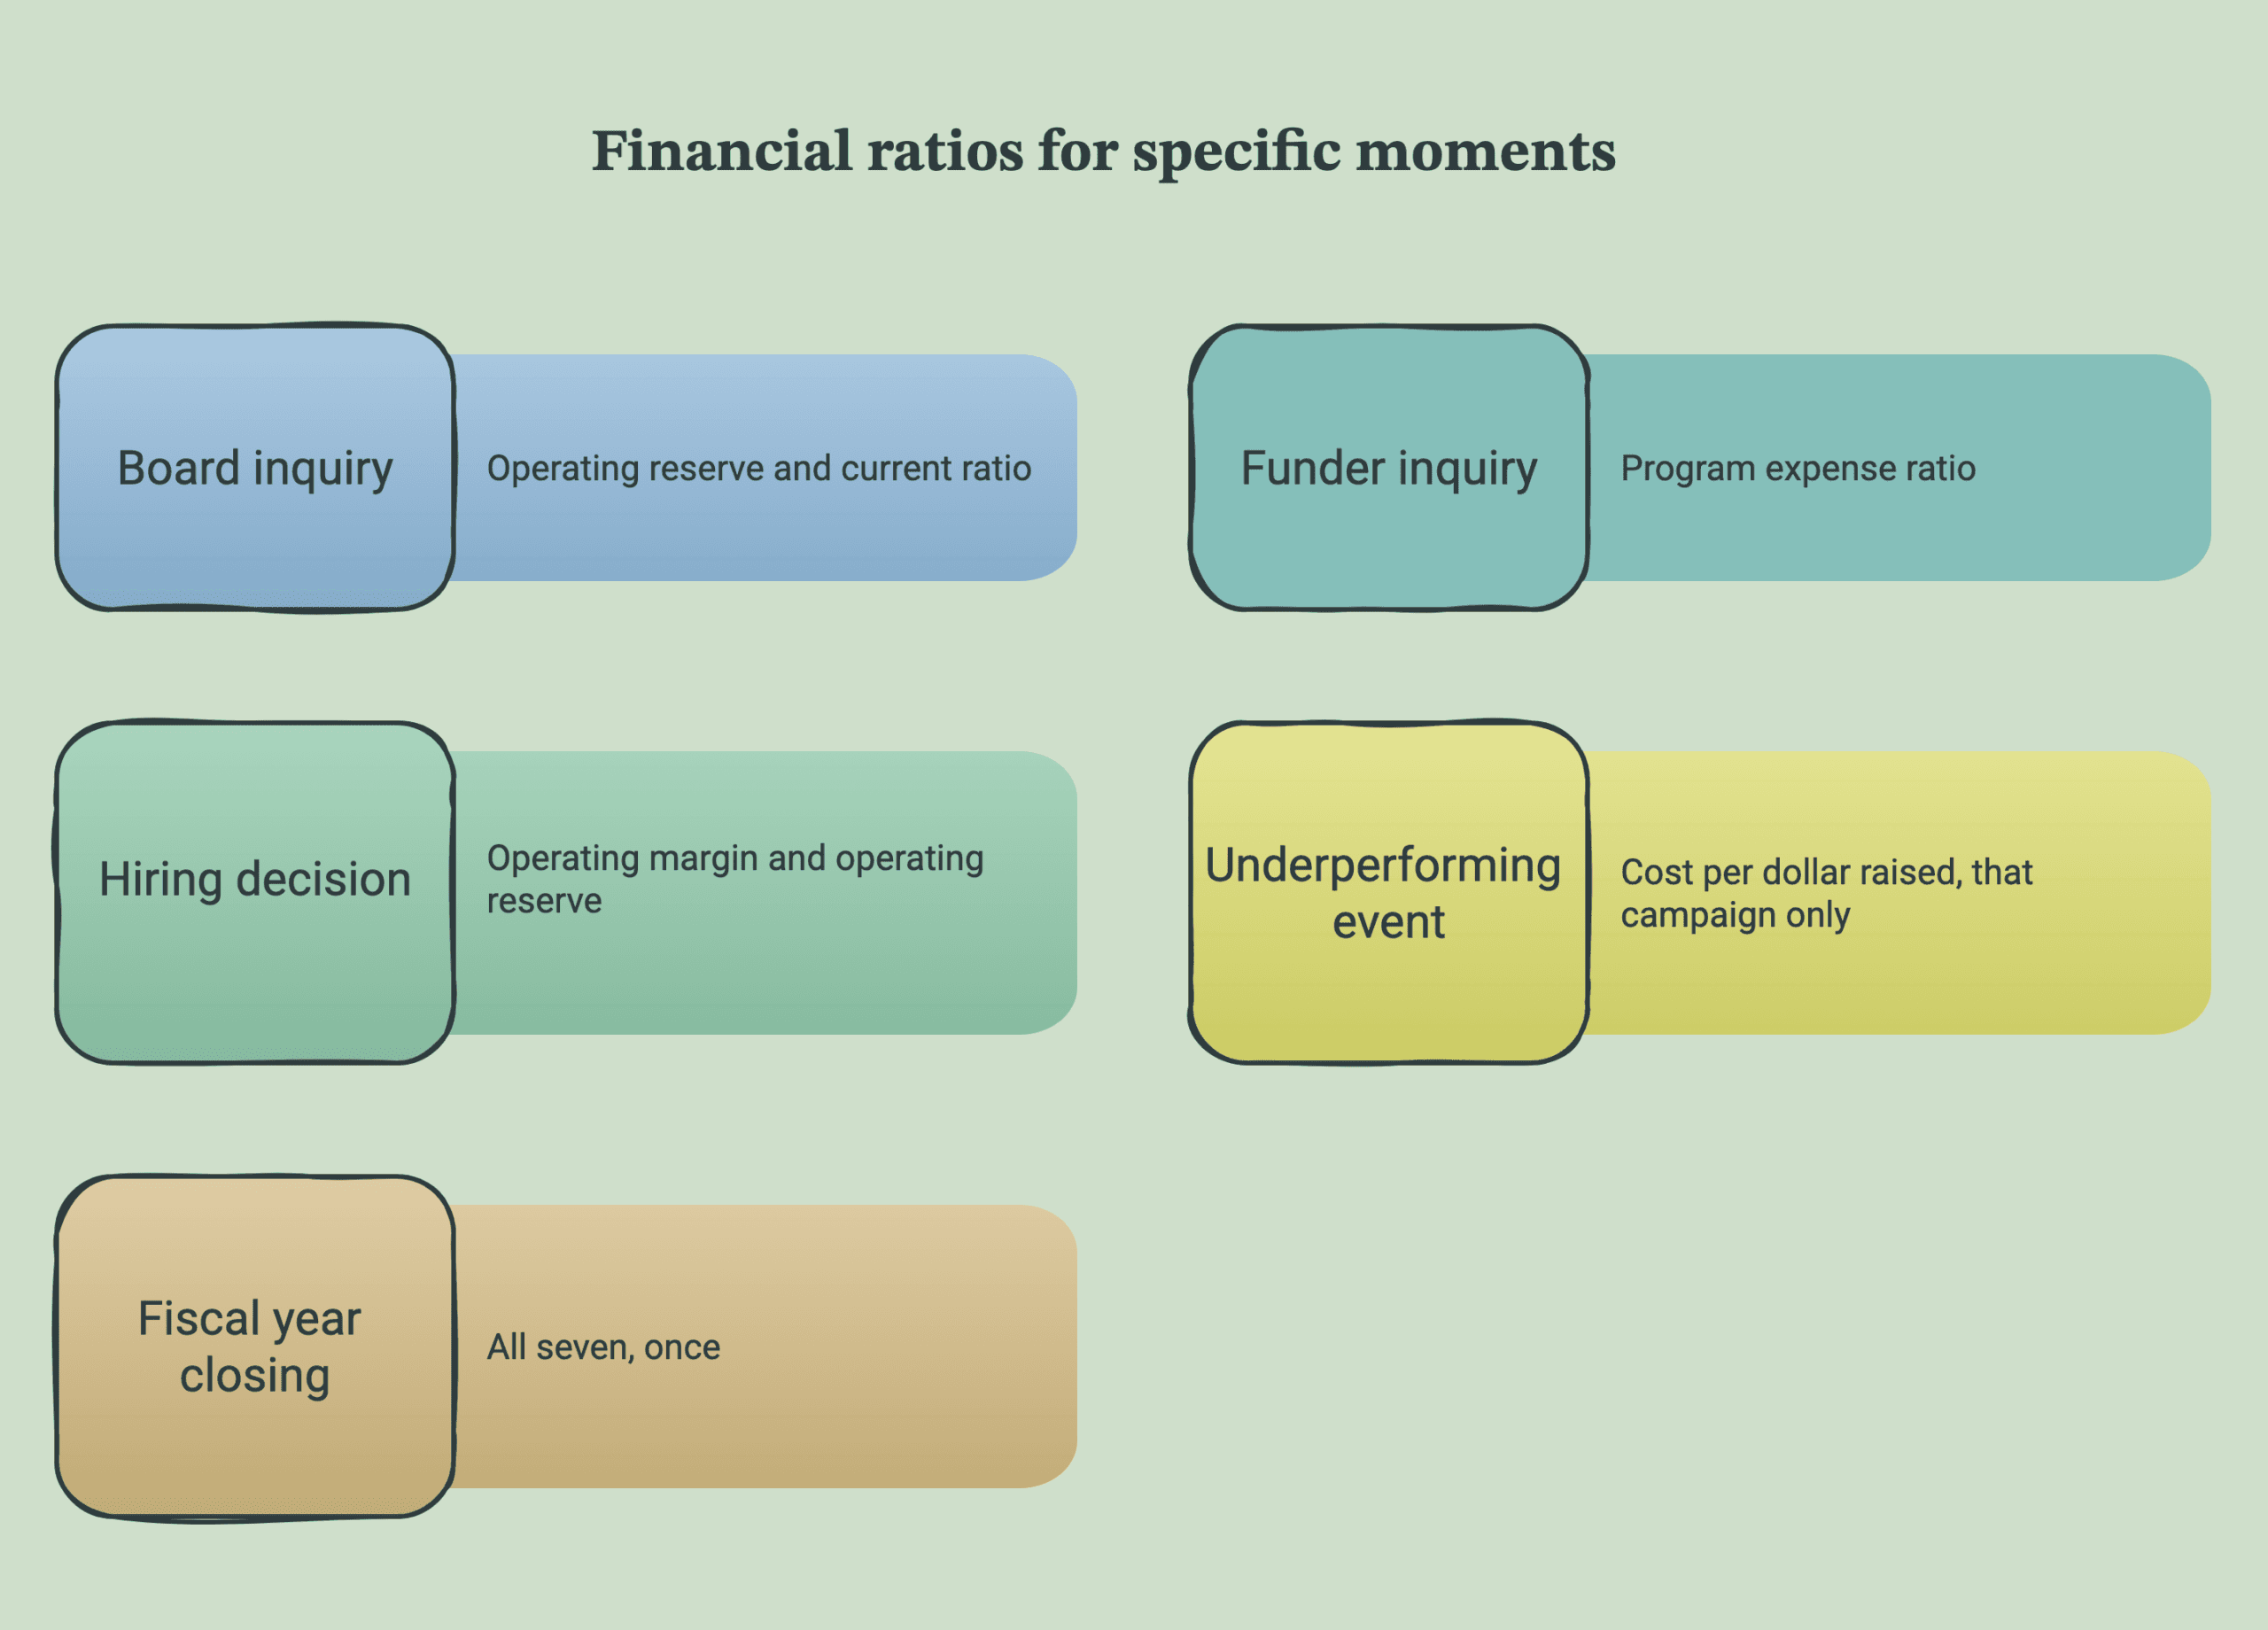
Here is the practical reframe. Nobody wakes up wanting to calculate a current ratio. What actually happens is that a decision arrives, and somewhere inside that decision is a financial question you cannot answer by feel. These are the five that recur.
The board asks whether the organization is okay
Reach for operating reserve and current ratio. Together they answer the two versions of the question the board is really asking: could we survive a bad quarter, and can we cover the obligations coming due over the next twelve months. Bring both, because a healthy reserve with a liquidity problem is a real and confusing situation.
A funder asks about overhead
Reach for program expense ratio. Know your number before the application asks for it, because the moment to fix a weak one is during the year, in how expenses are coded and allocated — not in the two hours before a deadline.
You are deciding whether to hire
Reach for operating margin and operating reserve. A hire is a recurring commitment, so the question is not whether you can afford the first paycheck — it is whether the organization has generated a surplus consistently enough to carry a new salary through a slow year.
The event or campaign underperformed
Reach for cost per dollar raised and fundraising efficiency, calculated for that campaign alone rather than the whole year. An organization-wide fundraising number will quietly absorb a bad event and tell you nothing. The campaign-level number is where the decision lives.
The fiscal year is closing
Reach for all seven, once. This is the one time the full set is worth running, because the expense split and net asset figures behind several of these end up on your Form 990 whether you look at them or not. Running them yourself first means nothing on the return surprises you — and it pairs naturally with a year-end close checklist.
Notice what is missing from that list: a monthly ritual of calculating everything. A monthly ratio ritual is easy to start and hard to sustain, and when it lapses the abandonment feels like a personal failure when it is really a design problem. A number you look at when it can change a decision is worth more than six numbers you compile out of obligation.
Formulas below, but read the middle column first. If the question in that column is not one you currently have, the ratio next to it can wait.
| Ratio | The question it answers | Formula |
|---|---|---|
| Program expense ratio | How much of what we spend reaches the mission? | Program expenses ÷ total expenses |
| Operating reserve | How long could we run if revenue stopped? | Net assets without donor restrictions, less amounts invested in fixed assets ÷ annual operating expenses |
| Current ratio | Can we pay what is due in the next year? | Current assets ÷ current liabilities |
| Operating margin | Are we ending years with more than we started? | (Revenue − expenses) ÷ revenue |
| Fundraising efficiency | What does a dollar of fundraising bring back? | Contributions ÷ fundraising expenses |
| Cost per dollar raised | The same question, priced per dollar. | Fundraising expenses ÷ contributions |
| Donor retention rate | Are the people who gave last year still with us? | Donors who gave both years ÷ prior-year donors |
Two of these are the same question asked in opposite directions. Fundraising efficiency and cost per dollar raised are reciprocals — if a dollar of fundraising brings back four dollars, your cost per dollar raised is twenty-five cents. Report whichever one your audience thinks in. Boards tend to hear the ratio; development staff tend to think in cost.
The seventh is the odd one out, and deliberately so. Donor retention is the only ratio here that is not calculated from your financial statements — it comes out of your donor database, and it is the earliest warning signal on this list. Revenue can hold steady for a year while your donor base quietly erodes underneath it. That gap is the subject of our guide to donor retention for small nonprofits.
Want the numbers without the arithmetic? Our free calculator runs all seven from figures you already have on your statements, and shows where each one lands.
Financial Ratios Calculator →This is the part that determines whether any of the above is worth doing, and it is the part usually skipped.
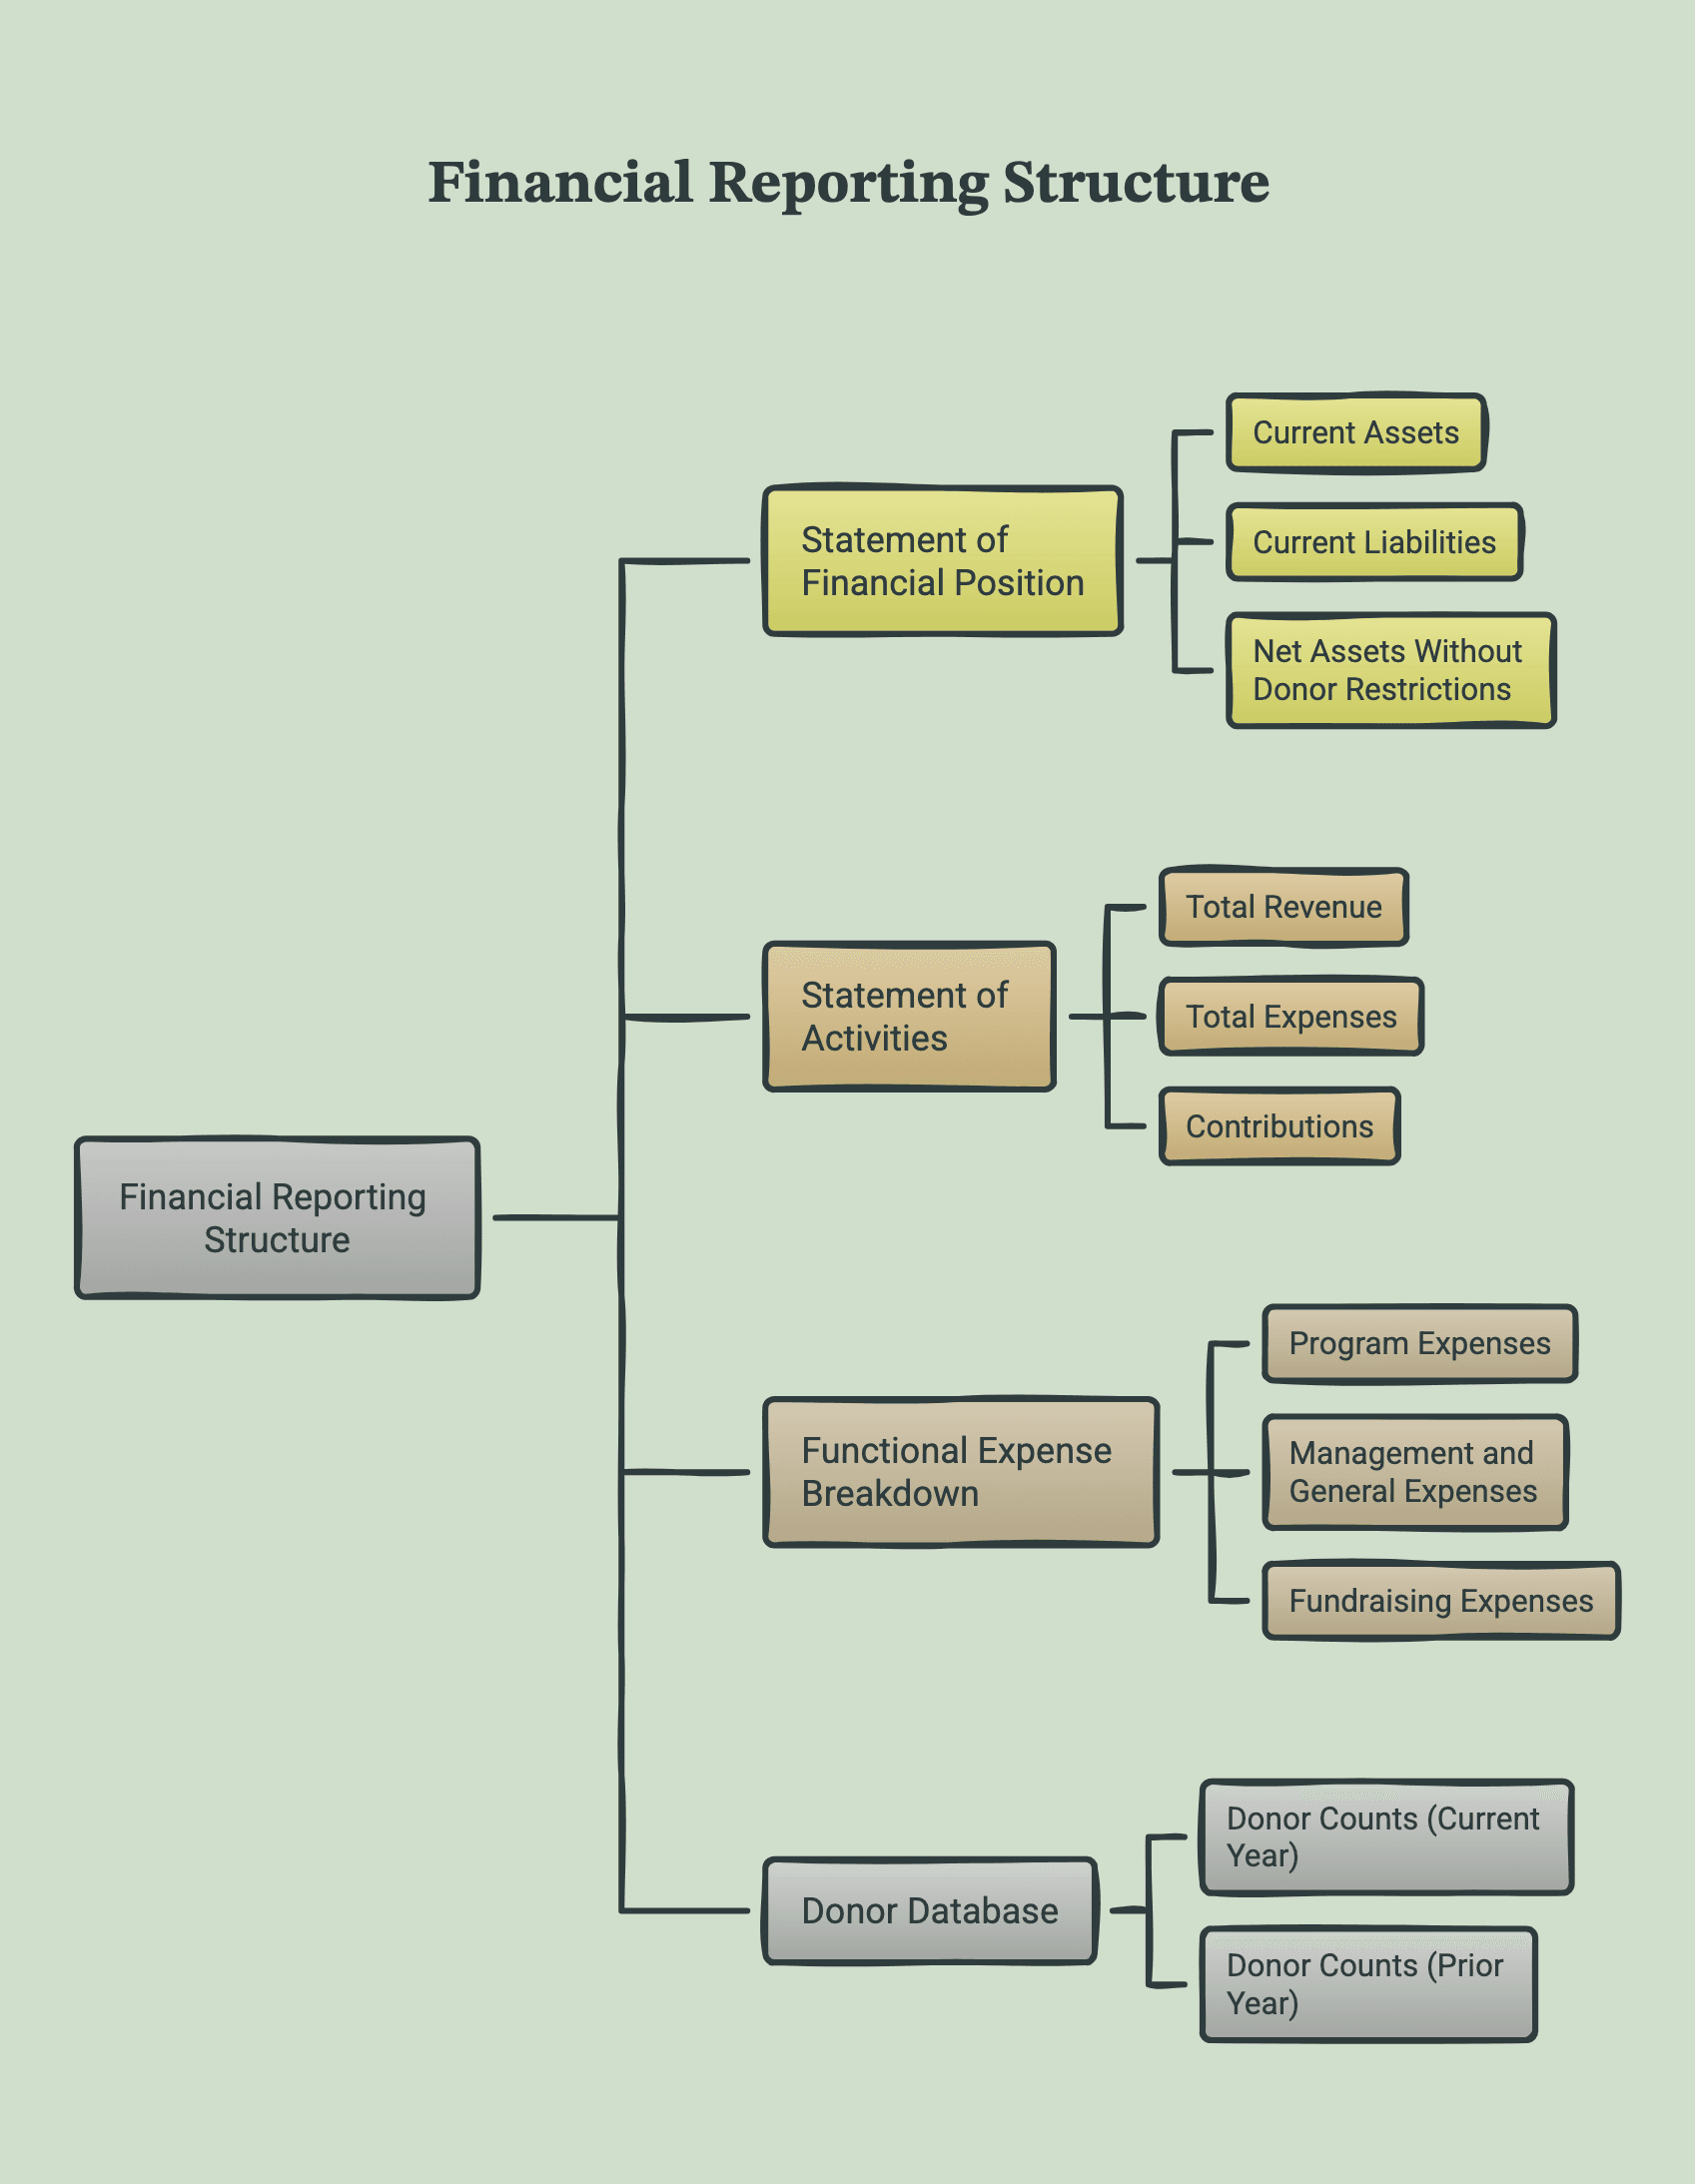
Six of the seven ratios read directly off your financial statements — the statement of financial position, the statement of activities, and your functional expense breakdown. If you can read those, you can source every input in about ten minutes. Our walkthrough of how to read nonprofit financial statements covers where each line sits.
Where each input lives
Which brings up the uncomfortable dependency. The program expense ratio is entirely a product of how your expenses are split between program, management and general, and fundraising. If your executive director’s salary is coded 100% to management when a real share of that time is spent delivering programs, your ratio is understated and you are being penalized by your own bookkeeping. If it is coded aggressively the other way, you have a number you cannot defend in an audit.
That allocation is not a judgment call you make once a year at ratio time. It is a monthly discipline in how transactions get coded, which is why the honest answer to “how do we improve our program expense ratio” is almost always upstream, in how the books are kept, rather than in the ratio itself.
Benchmarks for nonprofit financial ratios circulate in this sector with remarkable confidence and remarkably little citation. Some of them are real published standards. Some are conventions that got repeated until they sounded official. It is worth knowing which is which, because you will be quoting them to a board.
Benchmarks with a real source
Program spending — at least 65%
BBB Wise Giving Alliance Standard 8 requires a charity to spend at least 65% of total expenses on program activities to meet its accountability standards.
Program spending — 70% for full credit
Charity Navigator awards full credit on its Program Expense metric to organizations at 70% or more of total expenses, averaged over the three most recent fiscal years, and no points on that metric below 50%. Note the three-year averaging — a single unusual year moves this less than you would expect.
Fundraising cost — no more than 35% of contributions
BBB Standard 9 sets fundraising expenses at no more than 35% of related contributions. Note the denominator is contributions, not total expenses — a distinction that changes the answer.
Operating reserve — three months, then six
The Nonprofit Operating Reserves Initiative workgroup recommended a minimum operating reserve ratio of 25% of the annual operating expense budget — roughly three months. The “six months” half of the familiar three-to-six-month range is common practice rather than part of that recommendation. How much cushion your own organization needs depends on how predictable its revenue is, which we work through in how many months of cash your nonprofit actually needs.
Donor retention — the sector average is public
The Fundraising Effectiveness Project publishes an overall retention rate quarterly; it reported 43.3% for full-year 2025. That is a comparison point rather than a target — it is where the sector is, not where anyone says you should be.
Current ratio — a convention, not a charity standard
Worth naming separately: no charity rater publishes a current ratio threshold. The commonly used floor of 1.0 — current assets at least equal to current liabilities — is a general accounting convention that applies to any organization, not a nonprofit benchmark. Below 1.0 means obligations coming due exceed the assets available to meet them, which is a genuine signal; above it, the number tells you less than your cash flow projection does.
And the ones without a citable source: the frequently repeated targets for operating margin and for cost per dollar raised. We have not found a primary standard behind figures like “a margin above 5% is healthy” or “under twenty-five cents per dollar raised is ideal,” and we would rather say so than pass them along with a confident face. On the fundraising side that gap is documented: AFP partnered with the Center on Philanthropy specifically to establish research-based fundraising cost guidelines and concluded they could not be determined, because organizations calculate the metric too differently to compare. BBB Standard 9 above is the closest thing to a published ceiling, and it is expressed against contributions rather than per dollar. For operating margin the more defensible framing is directional — a small positive surplus sustained across several years is what builds a reserve, and a repeated deficit is the signal, not any particular percentage.
Cost per dollar raised deserves one more caution. It varies enormously by what you are counting — an established annual fund and a first-year donor acquisition campaign are not comparable, and a capital campaign is a different animal again. A single organization-wide figure blends all of them into a number that describes none of them.
Every one of these nonprofit financial ratios has a failure mode, and they are consistent enough to list. If your ratio looks surprising, check this before you act on it.
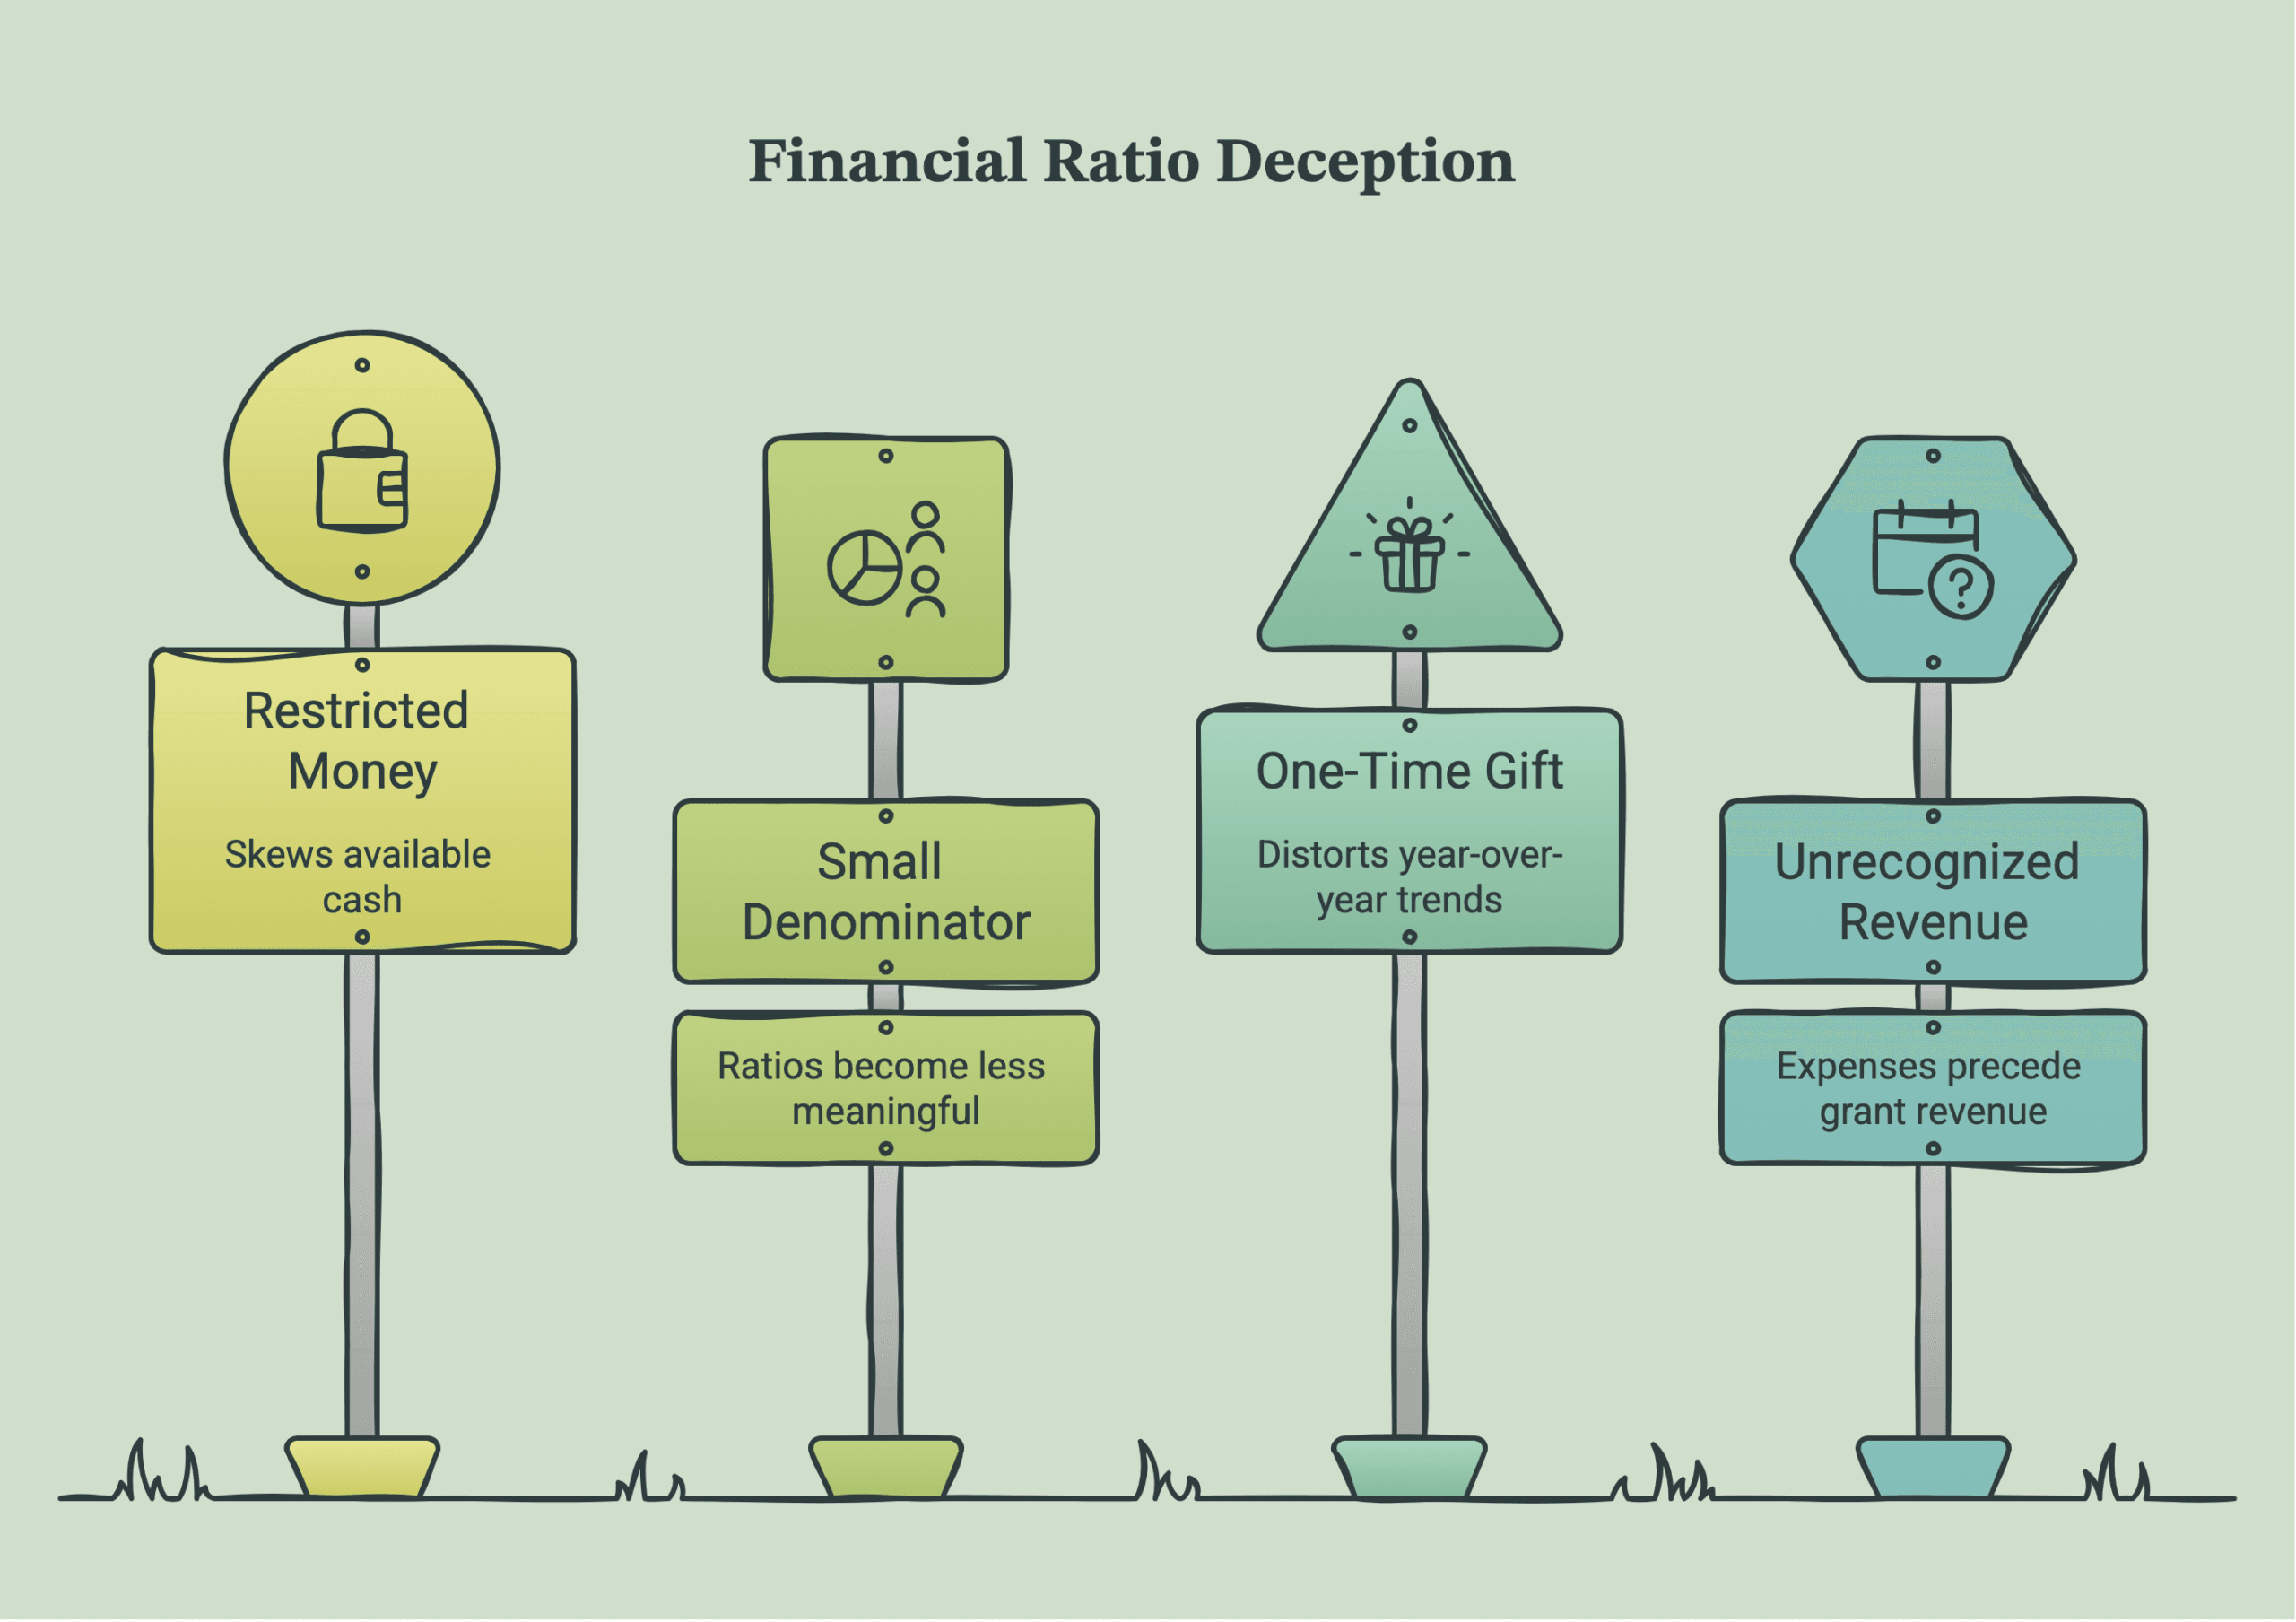
Four ways a ratio lies
Restricted money counted as available. The operating reserve ratio uses net assets without donor restrictions for a reason. Include restricted funds and you will report a comfortable reserve you are not legally free to spend — the single most common error on this list.
A small denominator. An organization with $12,000 of fundraising expense that raised $60,000 has a fundraising efficiency of 5:1, which sounds excellent and mostly means the numbers are small. Ratios get less meaningful as the inputs shrink.
A one-time gift flattening the year. A large capital grant lifts your operating margin and your program ratio in the year it lands, then drops both the following year. Neither movement describes what actually changed. Look at a three-year line before you read a trend into one.
Growth that hasn’t hit the books yet. Add a program mid-year and the expenses appear before the associated grant revenue is recognized. A margin that dips in a growth year is often timing, not trouble.
There is one more failure mode that is not arithmetic. A low program expense ratio is sometimes just an organization investing in the infrastructure it needs — a real finance system, an actual database, staff who are paid enough to stay. Those show up as management and general expense and pull the ratio down in the exact year the organization is getting stronger. If you are going to report the number, report the context with it, because nobody else will.
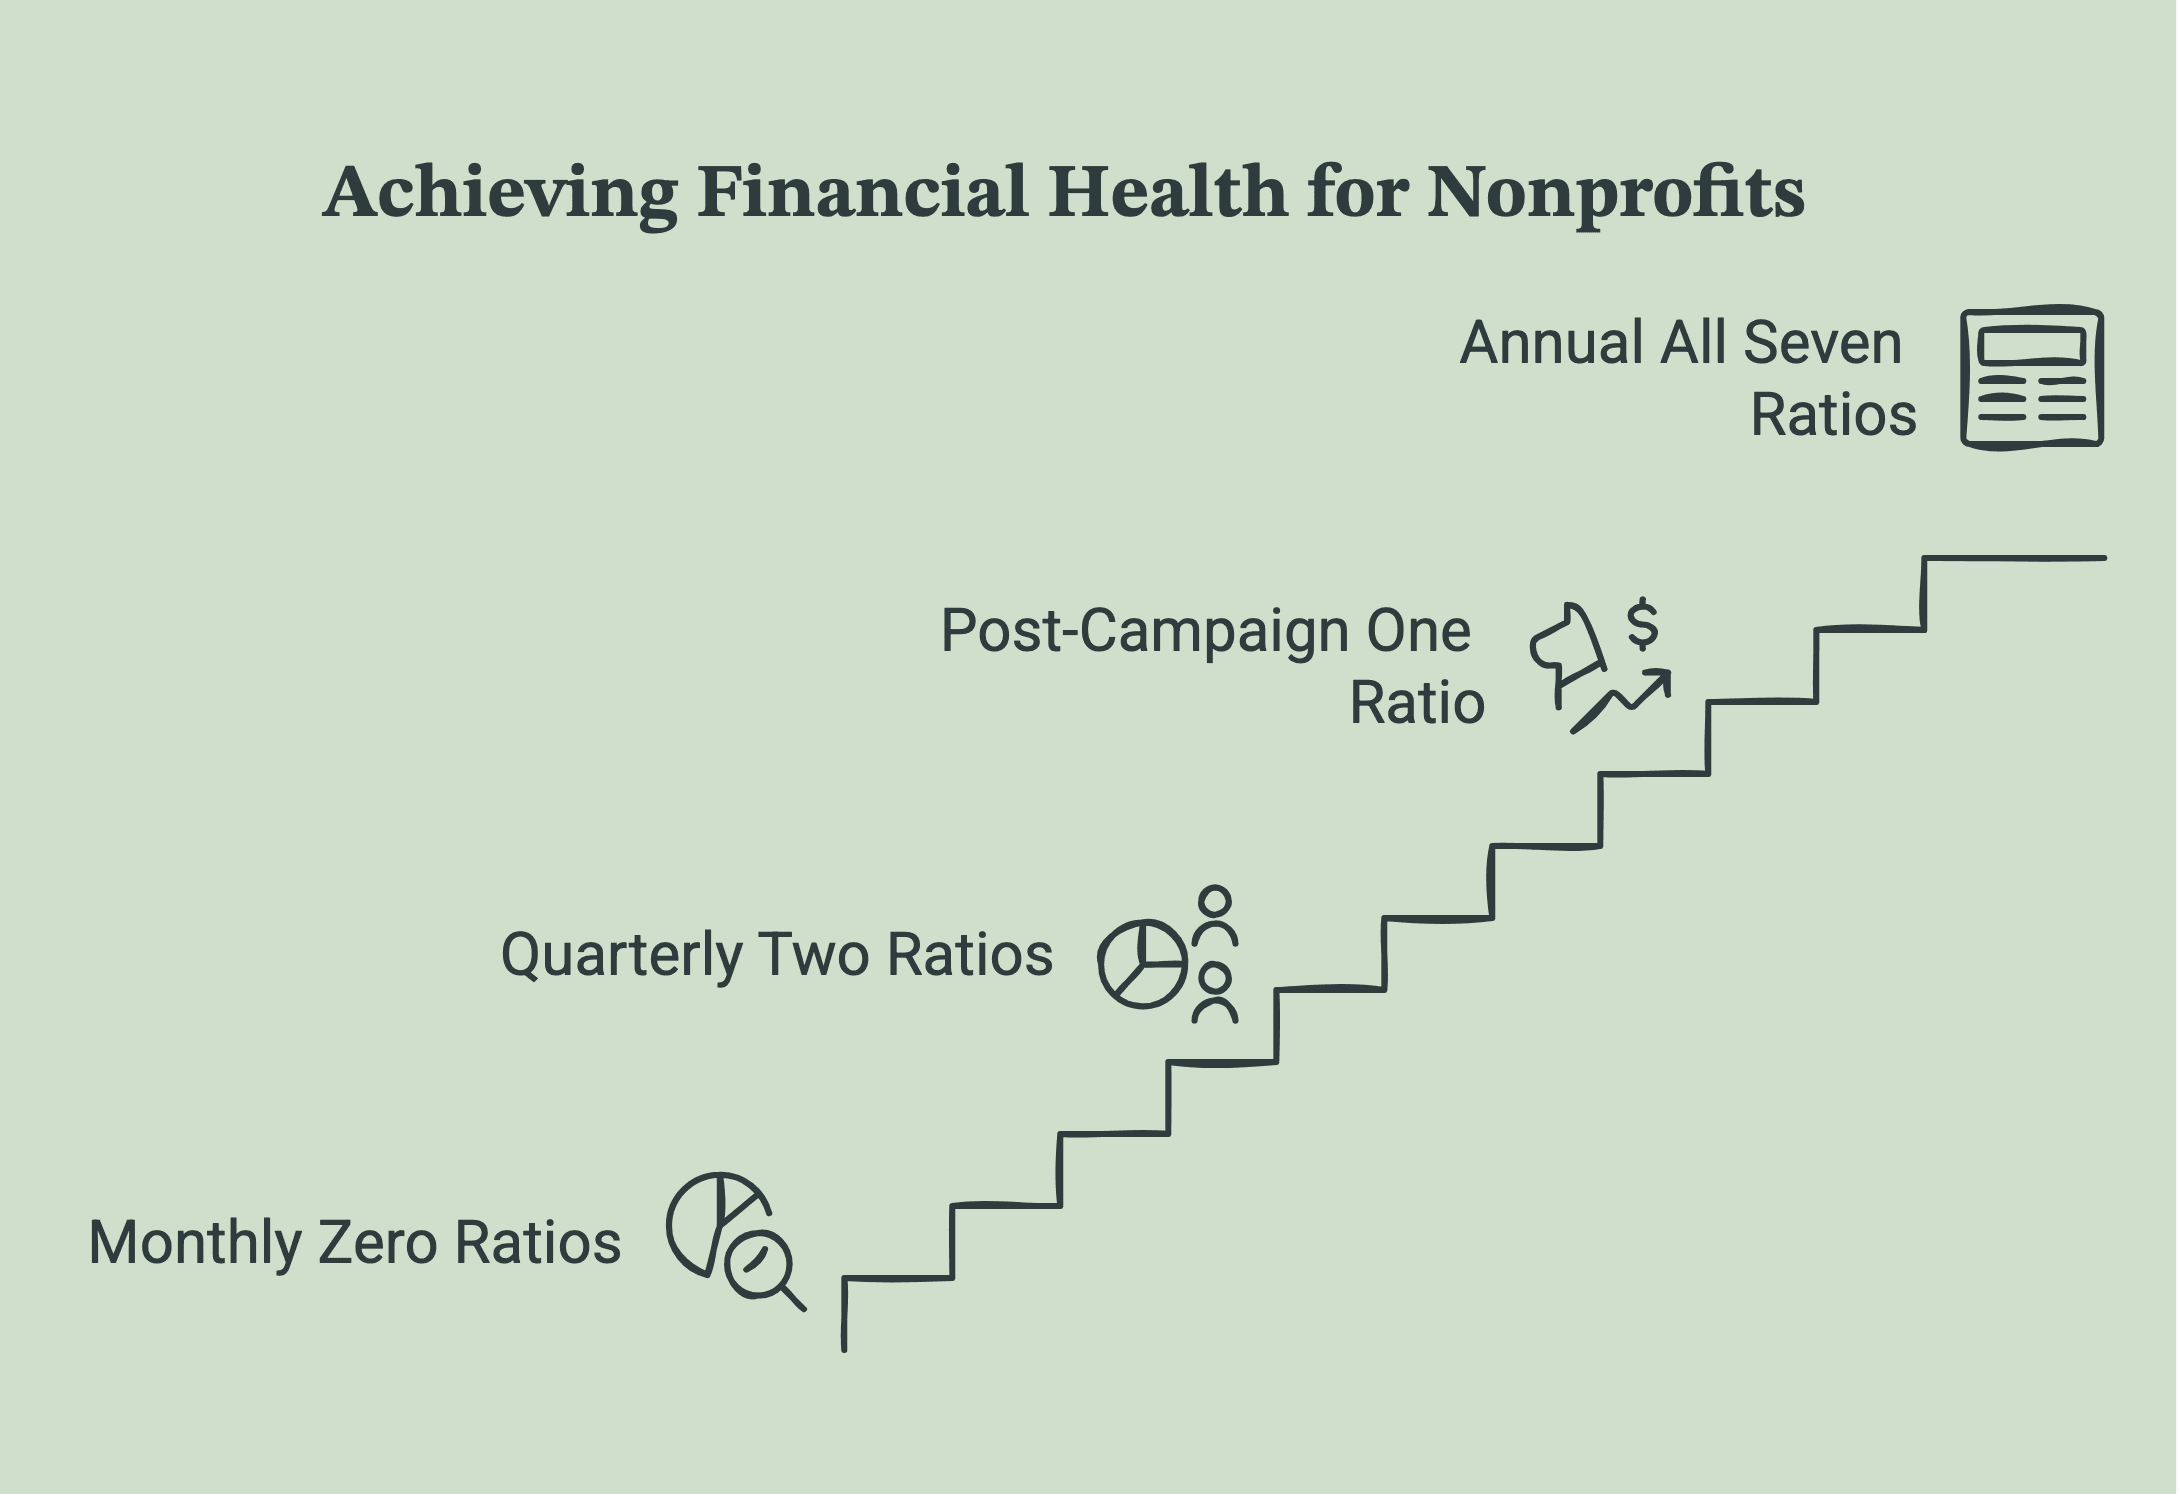
The cadence below is deliberately light. Start here, and add to it only when a specific question makes you want a number more often — not because a longer list looks more rigorous.
MONTHLY — ZERO RATIOS
Close the books and check cash. That is the whole monthly job. Ratios calculated on unreconciled books are noise, and the close is what makes everything downstream possible.
QUARTERLY — TWO RATIOS
Operating reserve and current ratio, in the board packet. These two answer the question a board is going to ask anyway, and putting them in front of the ask is what turns a finance report into a conversation.
AFTER EACH CAMPAIGN — ONE RATIO
Cost per dollar raised for that campaign, calculated within a month while everyone still remembers what was spent. This is the number that changes what you do next year.
ANNUALLY — ALL SEVEN
At year-end close, alongside the numbers headed for your Form 990. Save them. A single year of ratios tells you very little; the third year is when the set starts being genuinely useful.
That last point is the one worth being patient about. Almost everything valuable about these numbers is comparative, and you cannot compare against a history you have not started keeping. An organization that has run the same seven ratios for three years can see its own shape. One that calculates them for the first time the week a funder asks has a number and no idea what it means.
So the answer to the board member’s question is not a percentage. It is: here are the two numbers that describe our position, here is which direction they moved, and here is what we would do if they moved further. That is an answer someone can act on — which was the point of running the numbers in the first place.
Common questions from EDs and treasurers putting these numbers in front of a board.
Two published standards frame the answer. BBB Wise Giving Alliance Standard 8 requires at least 65% of total expenses to go to program activities, and Charity Navigator awards full credit on its Program Expense metric at 70% or more of total expenses, averaged over the three most recent fiscal years, with no points below 50%. Both are floors rather than goals, and neither measures whether the program works.
The Nonprofit Operating Reserves Initiative workgroup recommended a minimum of 25% of the annual operating expense budget — about three months. The six-month figure in the familiar three-to-six-month range is common practice rather than part of that recommendation. The right figure depends on how predictable your revenue is; an organization funded by one annual grant needs more cushion than one with diversified monthly giving.
Less often than most guidance suggests. Operating reserve and current ratio quarterly in the board packet, cost per dollar raised after each campaign, and the full set once at year-end close is a rhythm most small organizations can sustain. Ratios calculated on books that have not been reconciled are not worth the time it takes to produce them.
Six of the seven come from your financial statements — the statement of financial position supplies current assets, current liabilities, and net assets without donor restrictions, and the statement of activities supplies revenue, expenses, and contributions. The program, management and general, and fundraising splits come from your functional expense breakdown. Donor retention is the exception; it comes from your donor database, not your books.
Usually one of three things. Expense allocation changed, so time that genuinely supports programs is now coded to management and general. A one-time capital or infrastructure investment landed in the year. Or the organization invested in finance, technology, or staff retention — real strengthening that shows up as management and general expense and pushes the ratio down in the year it happens. Check the allocation first, then report the context alongside the number.
Not necessarily. A very high ratio often means the organization is under-investing in fundraising rather than excelling at it, and it can also simply reflect small numbers — modest fundraising spend against a couple of major gifts produces a flattering figure that says little. It is also worth calculating per campaign rather than organization-wide, since acquisition, annual fund, and capital campaigns have structurally different costs.
Every one of these ratios is only as good as the books underneath it.
GivingArc handles bookkeeping and Form 990 preparation for small and mid-size 501(c)(3)s.
Putting the numbers where people look
If a funder is going to work out these ratios, it helps when your latest Form 990 and statements are one click from your home page. Our sister practice, connectNPO, builds websites for small nonprofits that show what the money did: an Impact page with this year’s results, and a financials page with your latest Form 990 and statements, both brought up to date each year after the filing. You see the finished site before you pay for it; after that it is one plan, $180 a month.
See a sample financials page →
GivingArc and connectNPO are both run by Daybooks Web Solutions, LLC.
GivingArc provides bookkeeping, Form 990 preparation, and nonprofit-specialized accounting for small and mid-size 501(c)(3) organizations across the US. This article is general information, not legal, tax, or financial advice. Benchmark figures are attributed to their publishing organizations; where no primary source exists we have said so. Reviewed by Min Kim, CPA.